
View all trades documented on TradeJournal using Fibonacci Retracement. Note that these are only if trades manually mark the trade as Fibonacci Retracement. There are also many more documented patterns with slight deviations from Fibonacci Retracement such as Fibonacci Daily Retracement Rib - 50% or Fibonacci Monthly Retracement.
What is the fibonacci retracement indicator?
Fibonacci retracement is a technical analysis tool that uses horizontal lines to indicate areas of support or resistance at the key Fibonacci levels before the price continues in the original direction. These levels are derived from the Fibonacci sequence and are commonly used in conjunction with trend lines to find entry and exit points in the market.
The Fibonacci retracement levels are commonly plotted after a price trend, in an attempt to predict the extent of a correction or pullback. The most popular levels are 38.2%, 50%, and 61.8%, which are derived from ratios found in the Fibonacci sequence. The 38.2% level is often considered a significant support or resistance level, while the 50% level is thought to have less significance. The 61.8% level is considered a key level and is often watched by traders as a potential reversal point.
How to use Fibonacci Retracement?
To plot the Fibonacci retracement levels, a trader must first identify the significant high and low points in the price chart. The trader then draws a horizontal line at the high point and another at the low point and applies the Fibonacci ratios to these points to plot the retracement levels. The price may then be monitored for trading opportunities at these levels. It's important to note that the Fibonacci retracement levels are only a prediction and should be used in conjunction with other technical analysis tools and fundamental analysis to make informed trading decisions.
Here are some typical steps:
-
Identify the trend: Before applying the Fibonacci retracement tool, it's important to identify the overall trend of the market. This can be done by using trend lines or by looking at the slope of the moving average.
-
Identify the high and low points: Next, identify the significant high and low points in the price chart that you want to use as the reference points for the Fibonacci retracement levels. These points will be used to plot the retracement levels.
-
Draw the Fibonacci retracement levels: Using your trading platform, draw a horizontal line at the high point and another at the low point. Then apply the Fibonacci ratios to these points to plot the retracement levels. The most commonly used ratios are 38.2%, 50%, and 61.8%.
-
Look for potential trade opportunities: As the price moves, watch for potential trade opportunities at the key Fibonacci levels. If the price reaches a key level and begins to bounce off of it, it may be a good opportunity to enter a trade.
It's important to note that the Fibonacci retracement levels are just one tool in a trader's toolkit and should be used in conjunction with other technical and fundamental analysis techniques to make informed trading decisions.
One of our users Trading Precise breaks down the Fibonacci retracement on a trade he did in this timestamped video.
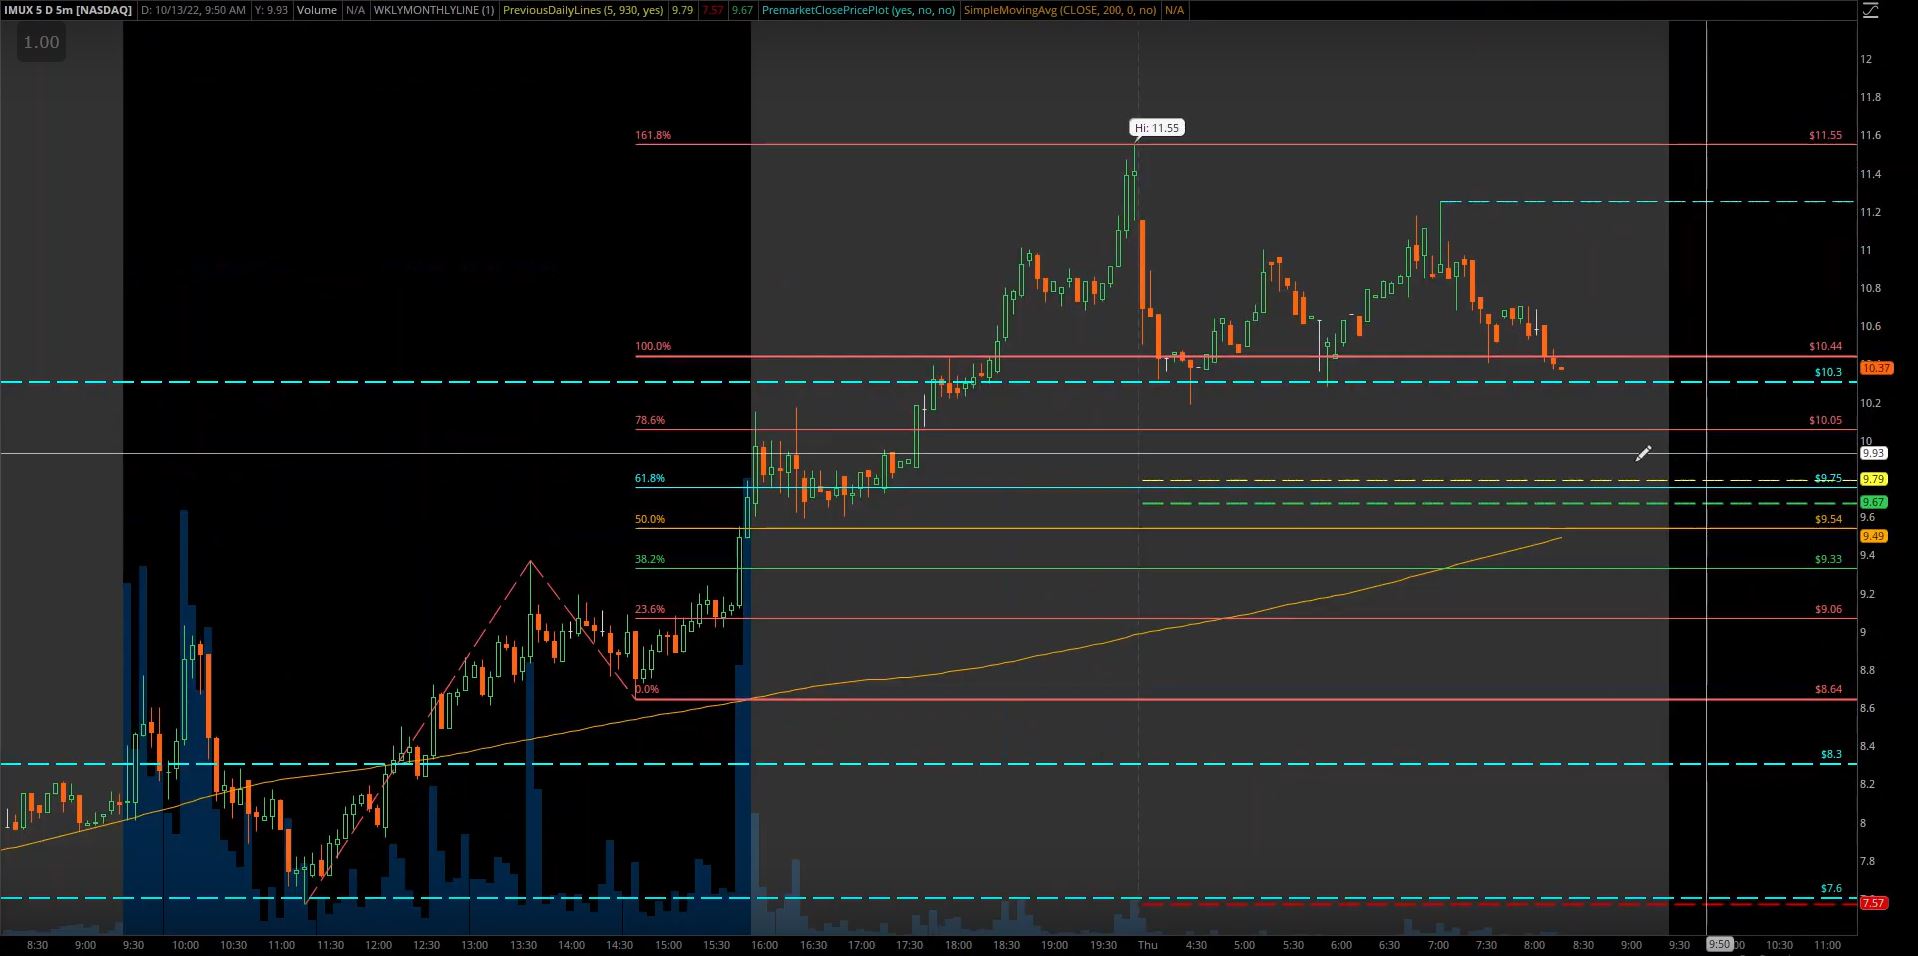
The 1st example with IMUX is actually fix extension but was so perfect. You can trace the move from $7.6 to $9.33 and then back down to $8.65. Then perfectly hit the 161.8% fib all the way at the top.
-----
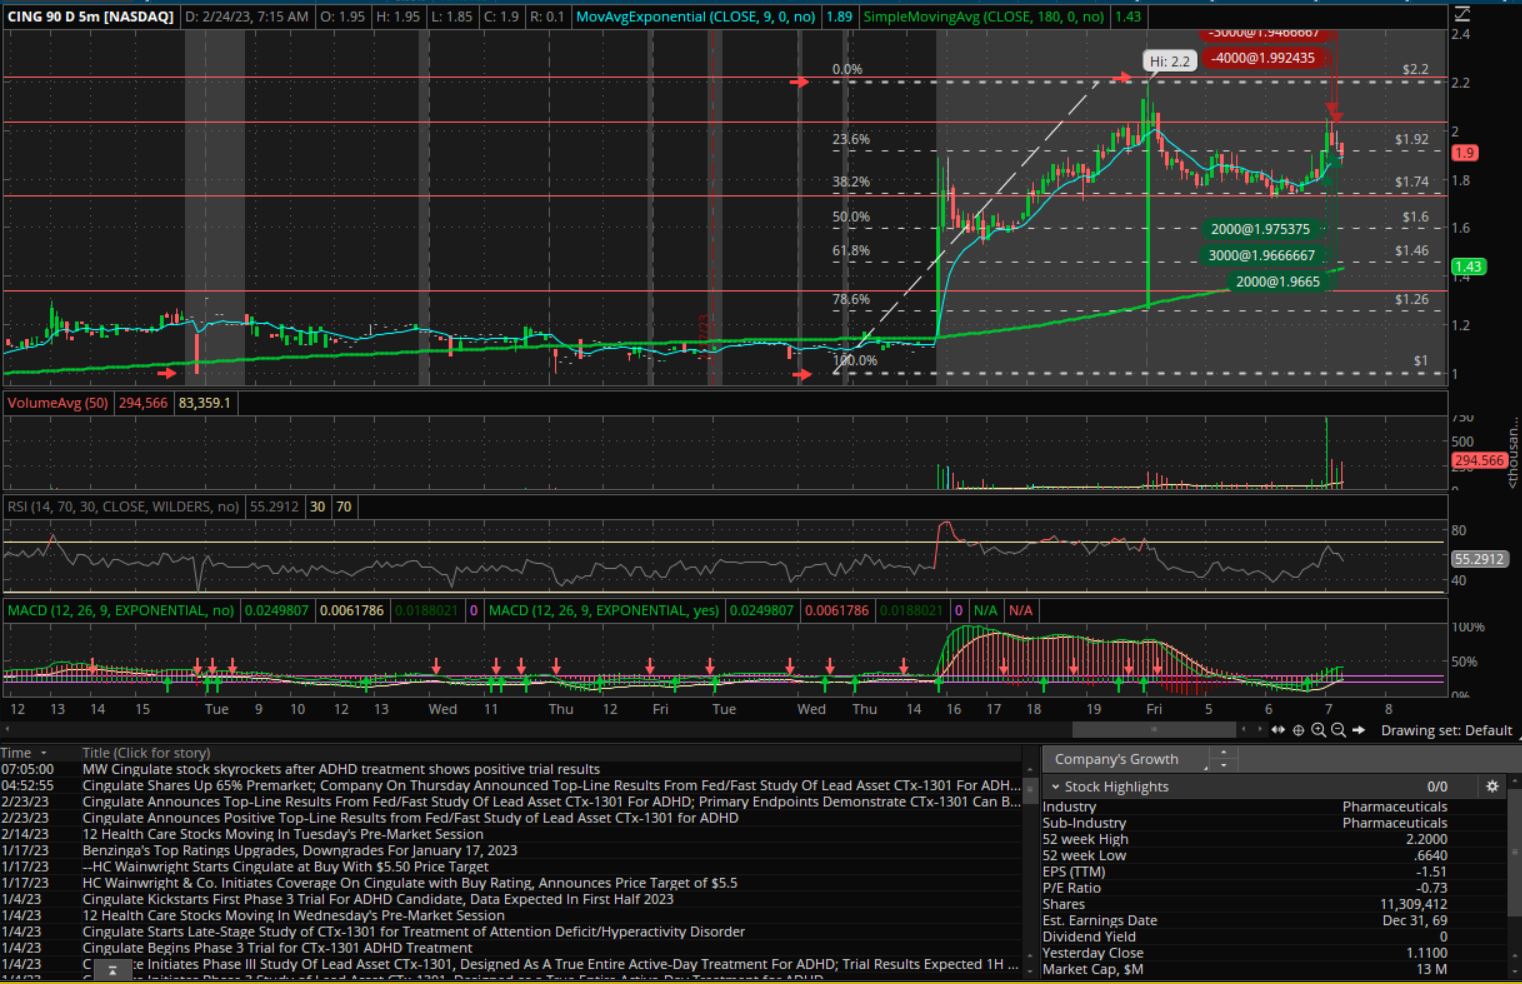
The 2nd example from the low of $0.99 move to $2.2 using Fib retracement.
What is the best Fibonacci Retracement strategy?
There is no one "best" Fibonacci retracement strategy, as different strategies may work better in different market conditions. However, there are a few general guidelines that traders can follow when using Fibonacci retracement as part of their trading strategy:
-
Use in conjunction with other technical analysis tools: Fibonacci retracement should not be used in isolation, but rather in conjunction with other technical analysis tools such as trend lines, moving averages, and oscillators.
-
Confirm with other analysis methods: It's important to confirm any potential trade signals with other analysis methods, such as fundamental analysis or sentiment analysis.
-
Consider the overall trend: Fibonacci retracement works best in trending markets, so be sure to consider the overall trend of the market before making any trades.
-
Use stop-loss orders: As with any trading strategy, it's important to use stop-loss orders to manage risk and protect against potential losses.
-
Test the strategy: As with any trading strategy, it's important to test the strategy on historical data to see how it would have performed under different market conditions. This can help you fine-tune the strategy and increase your chances of success.
One popular setup for using Fibonacci retracement in a trading strategy is to look for potential trade opportunities at key Fibonacci levels during a corrective pullback in an uptrend. In this setup, the trader would first identify the overall uptrend and then wait for a correction or pullback to occur. Once the correction has started, the trader would apply the Fibonacci retracement tool and look for potential trade opportunities at the 38.2%, 50%, and 61.8% levels. If the price bounces off of one of these levels, it may be a good opportunity to enter a long trade.
Another popular setup is to use Fibonacci retracement in conjunction with trend lines to identify potential entry and exit points in a trend. In this setup, the trader would draw trend lines on the price chart and then apply the Fibonacci retracement tool to identify potential support and resistance levels. If the price bounces off of a key Fibonacci level and the trend line, it may be a good opportunity to enter a trade in the direction of the trend.
It's important to note that these are just a few examples of how Fibonacci retracement can be used in a trading strategy and that different setups may work better in different market conditions. It's always a good idea to test any trading strategy on historical data before implementing it in live trading.